例えば、国語のテストがあった時に、XクラスとYクラスのテストの点数の平均値に差があるのか?ないのか?を知りたいとします。
 隣のクラスと差があるのか..??
各クラスのテストの点数の平均値を比較する際に使用するのは対応のない2群の検定です。
各クラスに在籍する学生は異なるため、”対応のない”2群の検定を行います。
同じ学生が異なるAとBのテストを受けた場合などを検定する場合は、”対応のある”2群のt検定を行います。詳しくは、下記のサイトをご確認ください。
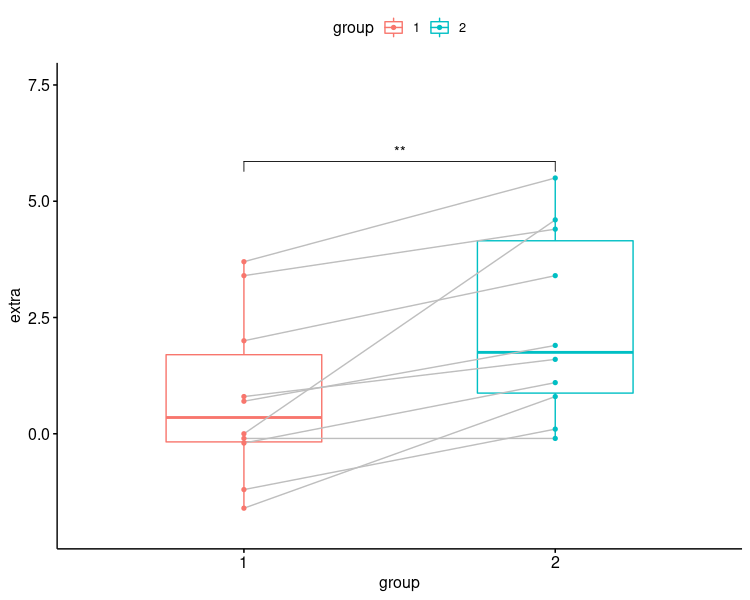
1. 対応のない2群検定とは。検定を行う前に、正規性(シャピロ・ウィルク検定)と等分散(F検定)を確認
2. 正規分布で、等分散であるStudent t 検定
3. 正規分布で、等分散ではないWelch’s t 検定
4. Rでプレゼンテーション ーWelch’s t 検定, 箱ひげ図+バイオリン+ビースウォームプロットー
1.対応のない2群検定とは。検定を行う前に正規性(シャピロ・ウィルク検定)と等分散(F検定)を確認
比較する個体と事象が、いずれも異なる場合に”対応のない”2群のt検定を用います。
2群間の平均値に統計学的有意差があるかを調べます。
対応のない2群検定を行う場合、正規性と分散性を確認して、使用する手法を決めます。
| 正規性 | 等分散性 | 選択手法 |
| ◯ | ◯ | Student t 検定 |
| ◯ | × | Welch’s t 検定 |
| × | × | Man Whitney U 検定 (= Wilcoxon signed-rank 検定) |
本記事では、正規性があって等分散である場合のStudent t 検定と、正規性があって分散性に差があるWelch’s t検定について説明します。
正規性がない場合は、以下をご参照ください。
t-160x90.png)
正規性はシャピロ・ウィルク検定で、分散性の差はF検定で確認できます。以下に方法を記載していきます。
2. 正規分布で、等分散であるStudent t 検定
※ダミーデータで失礼致します。
#2つのクラス(Xクラス, Yクラス)の国語の点数を読み込む。
X<-c(85,90,86,76,84,96,84,95)
Y<-c(88,74,80,86,73,79,80) #1

shapiro.test(X) #2 シャピロ・ウィルク検定
#   Shapiro-Wilk normality test
# data: X
# W = 0.93449, p-value = 0.5578
# shapiro.test(Y)
#  Shapiro-Wilk normality test
# data: Y
# W = 0.92602, p-value = 0.5175
# var.test(x=X,y=Y) #3 F検定
#  F test to compare two variances
# data: X and Y
# F = 1.3733, num df = 7, denom df = 6, p-value = 0.715
# alternative hypothesis: true ratio of variances is not equal to 1
# 95 percent confidence interval:
#  0.2411165 7.0292248
# sample estimates:
# ratio of variances
# 1.373272
#1 Xクラスは8名、Yクラスは7名がテストを受け、それぞれの点数をデータとして取り込みました。
#2 シャピロ・ウィルク検定を行いました。帰無仮説は「標本分布が正規分布に従う」です。
p-value<0.05で、正規性に従うといえない。p-value≧0.05で正規性に従う。 ⇒X、Yともに正規性に従う。
※正規性が確認できない場合は、マンホイットニーU検定を行います。
詳しくは、以下のサイトをご確認ください。
t-160x90.png)
#3 分散性を確認するF検定を行いました。F検定の帰無仮説は「2群の分散に統計学的有意差はない」です。
p-value<0.05であれば、分散性に差がないといえない。p-value≧0.05であれば、分散性が差がない。 ⇒p-value = 0.715で、2群間は等分散である。
これらの検定結果から、Student t検定を行うことにしました。
t.test(x=X,y=Y,var.equal=T,paired=F) #4 Student t 検定
# 	Two Sample t-test
# data:  X and Y
# t = 2.2166, df = 13, p-value = 0.0451
# alternative hypothesis: true difference in means is not equal to 0
# 95 percent confidence interval:
#   0.1777051 13.8222949
# sample estimates:
# mean of x mean of y
#        87        80
#4 Student t 検定を行いました。帰無仮説は「2群の平均値に統計学的有意差がない」です。
p-value<0.05 なので帰無仮説が棄却されます。データXの平均値とデータY平均値には差がないといえない。統計学的有意差があると結論づけます。
name1<-c("X","X","X","X","X","X","X","X")
D1  <- data.frame(Class=name1, Score=X) #5
D1
#  Class Score
# 1  X  85
# 2  X  90
# 3  X  86
# 4  X  76
# 5  X  84
# 6  X  96
# 7  X  84
# 8  X  95
name2 <-c("Y","Y","Y","Y","Y","Y","Y")
D2  <- data.frame(Class=name2, Score=Y)  #6
D3<-rbind(D1, D2) #7
D3
#  Class Score
# 1  X  85
# 2  X  90
# 3  X  86
# 4  X  76
# 5  X  84
# 6  X  96
# 7  X  84
# 8  X  95
# 9  Y  88
# 10   Y  74
# 11   Y  80
# 12   Y  86
# 13   Y  73
# 14   Y  79
# 15   Y  80

library(ggplot2)
ggplot(D3, aes(x=Class, y=Score,color=Class)) +
 geom_boxplot(lwd=1.5)+
 theme_classic()+
 theme(axis.text=element_text(size=16),axis.title=element_text(size=18),legend.position = "none")+
 scale_color_manual(values = c("orange", "blue")) #8箱ひげ図

library(ggpubr)
ggplot(D3, aes(x=Class, y=Score,color=Class)) +
 geom_violin(lwd=1.5)+
 theme_classic()+
 stat_compare_means(comparisons = list(c("X", "Y")),label = "p.signif",method = "t.test")+
 theme(axis.text=element_text(size=16),axis.title=element_text(size=18),legend.position = "none")+
 scale_color_manual(values = c("orange", "blue"))   #9バイオリンプロット

library(ggbeeswarm)
ggplot(D3, aes(x=Class, y=Score,color=Class)) +
 geom_violin(lwd=1.0)+
 theme_classic()+
 theme(axis.text=element_text(size=16),axis.title=element_text(size=18),legend.position = "none")+
 scale_color_manual(values = c("orange", "blue")) +
 geom_boxplot(width = 0.4, lwd=1.0)+
 geom_beeswarm(color = "#84919e")  #10ビースウォームプロット(蜂群図)(+箱ひげ+バイオリンプロット)
#5, #6 は、ggplotでの作業を行いやすいよう、XとYのデータを結合しました。
#5でClassという名の列に、Xの名前を入れ、Scoreという名の列にX組の生徒の点数を入れたdata.frameを作成しました。
#6は、Xと同様のYに関する作業です。
#7 rbindでデータを縦に結合しました。
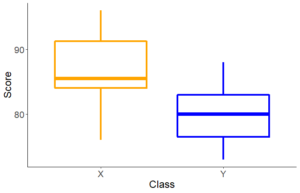
#8 箱ひげ図で表示。
中央値や四分位範囲をわかりやすく表示します。
ggplot(使用データ、 aes(x=横軸にクラス名、y=縦軸に生徒のスコア, color=クラスで色分け))
geom_boxplot(lwd=線の太さ) 箱ひげ図を書くコマンド
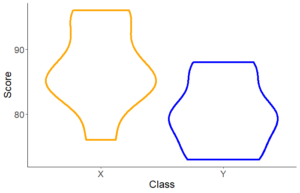
#9 バイオリンプロットで表示
箱ひげ図に比べ、数値の分布の形状がより分かりやすくなります。
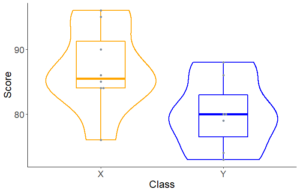
#10 箱ひげ+バイオリンプロット+ビースウォームプロット(蜂群図)
箱ひげ図とバイオリンプロットの良い点を合わせてみることができます。
そこに、プロット(+geom_beeswarm(color = “色指定”))を入れておくことで、実際の分布も分かります。
3. 正規分布で、等分散ではないWelch’s t 検定
#2つのクラス(Aクラス, Bクラス)の国語の点数を読み込む。
A<-c(85,90,86,76,84,96,84,95)
B<-c(50,54,60,86,30,79,80)
shapiro.test(A) #1
#  Shapiro-Wilk normality test
# data: A
# W = 0.93449, p-value = 0.5578
shapiro.test(B)
#  Shapiro-Wilk normality test
# data: B
# W = 0.93229, p-value = 0.5705

var.test(x=A,y=B) #2
#  F test to compare two variances
# data: A and B
# F = 0.10549, num df = 7, denom df = 6, p-value = 0.009026
# alternative hypothesis: true ratio of variances is not equal to 1
# 95 percent confidence interval:
# 0.01852116 0.53994400
# sample estimates:
# ratio of variances
# 0.1054867

t.test(x=A,y=B,var.equal=F,paired=F) #3
#  Welch Two Sample t-test
# data: A and B
# t = 3.0603, df = 7.1068, p-value = 0.01798
# alternative hypothesis: true difference in means is not equal to 0
# 95 percent confidence interval:
# 5.577922 42.993507
# sample estimates:
# mean of x mean of y
# 87.00000 62.71429
#1 シャピロ・ウィルク検定を行い、A、Bともにp-value≧0.05。正規性あり。
#2 F検定を行い、p-value<0.05。等分散性なし。⇒Welch’s t検定へ
#3 Welch’s t検定。帰無仮説は「2群の平均値に統計学的有意差がない」。
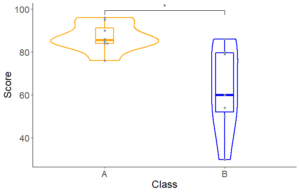
Aクラスは平均点87点、Bクラスは62.7点。p-value=0.01798。統計学的有意差あり(p<0.05)。
name3<-c("A","A","A","A","A","A","A","A")
D_A <- data.frame(Class=name3, Score=A)
name4<-c("B","B","B","B","B","B","B")
D_B <- data.frame(Class=name4, Score=B)
D_AB<-rbind(D_A, D_B) #4

library(ggpubr)

ggplot(D_AB, aes(x=Class, y=Score, color=Class)) +
 geom_violin()+
 theme_classic()+
 stat_compare_means(comparisons = list(c("A", "B")),label = "p.signif",method="t.test")+
 theme(axis.text=element_text(size=16),axis.title=element_text(size=18),legend.position = "none")+
 scale_color_manual(values = c("orange", "blue"))+
 geom_boxplot(width = 0.15, lwd=1.0)+
 geom_beeswarm(color = "#84919e") #5
#4 データの結合 (詳細は2.に記載)
#5 箱ひげ+バイオリンプロット+ビースウォームプロット(蜂群図)
stat_compare_means(comparisons = list(c(“A”, “B”)),label = “p.signif”,method=”t.test”) 有意差表示をしました。method=”t.test”は、Welch’s t検定を指定しています(デフォルトは、Man Whitney U検定(=Wilcoxon signed-rank 検定))。
+geom_beeswarm(color = “#84919e”)
4. Rでプレゼンテーション ーWelch’s t 検定, 箱ひげ図+バイオリン+ビースウォームプロットー
t.png)
3群以上の検定についても投稿していますので、ぜひ見ていって下さい。

参考図書

.png)


t-120x68.png)
コメント